
Learn 15 powerful app performance analytics strategies in 2026 to monitor speed, fix performance issues, improve user experience, and support growth.
Introduction
A fast and reliable app can make a major difference in user satisfaction, engagement, and business growth. App performance analytics helps developers and businesses understand how an application performs in real-world conditions by tracking factors such as loading speed, crashes, responsiveness, and user behavior. In 2026, using performance data can help teams identify technical problems faster, improve the overall user experience, and make informed decisions that support long-term app growth.
A single second can decide the fate of your app.
If your app loads slowly or crashes often, users leave. They do not wait. They do not try again. They simply uninstall and move on to a competitor.
This is why app performance analytics has become one of the most powerful tools for modern businesses. It helps you understand what users experience, where problems exist, and how to fix them before they impact growth.
Whether you are building a mobile app, managing a SaaS platform, or running the best account based marketing marketing agency, performance insights are essential. This guide will walk you through everything you need to know, in a simple and practical way, so you can improve your app and grow your business.
What Is App Performance Analytics
App performance analytics is the process of tracking, measuring, and improving how an application performs in real-world conditions.
It focuses on speed, stability, responsiveness, and user behavior. Instead of relying on assumptions, you get real data that shows how users interact with your app.
For example, you can see how long your app takes to load, how often it crashes, and which features users engage with the most.
This data allows you to make informed decisions and deliver a better experience.
Why App Performance Analytics Is Critical
Users expect instant results. If your app does not meet those expectations, they leave.
Studies show that nearly half of users expect an app to load within two seconds. If it takes longer, abandonment rates increase sharply.
Poor performance also leads to negative reviews, lower ratings, and reduced trust.
On the other hand, a fast and stable app improves engagement, boosts retention, and increases revenue.
For businesses, this means a direct link between performance and growth. For marketers, it means better campaign results and higher conversion rates.
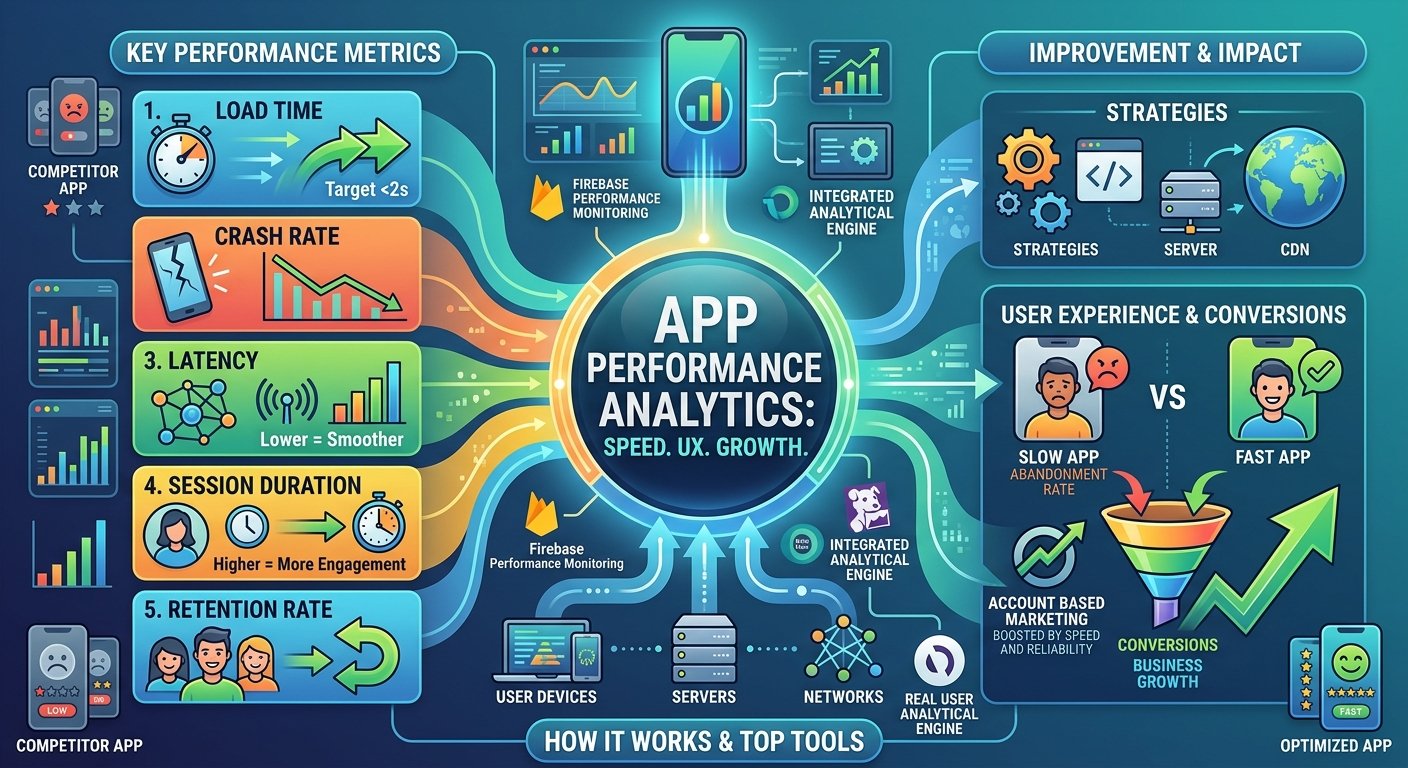
Key Metrics That Matter Most
Load Time
Load time is one of the first things users notice. A slow start creates a bad impression, while a fast load builds trust instantly.
Crash Rate
Crash rate shows how often your app fails. Even a small number of crashes can damage your reputation.
Latency
Latency measures the delay between user action and system response. Lower latency leads to smoother interactions.
Session Duration
This tells you how long users stay in your app. Longer sessions often indicate higher engagement.
Retention Rate
Retention rate measures how many users return after their first visit. Strong retention shows that your app delivers value.
Error Rate
Errors disrupt the user journey. Tracking and fixing them improves reliability and satisfaction.
How App Performance Analytics Works
App performance analytics tools collect data from different sources, including user devices, servers, and network conditions.
This data is processed into insights that help you understand performance issues.
For example, if users in a certain region experience slow load times, analytics will highlight this pattern. You can then optimize your infrastructure to fix the issue.
Real user monitoring plays a key role here. It captures actual user experiences instead of relying only on testing environments.
Top Tools for App Performance Analytics
Firebase Performance Monitoring
Firebase provides real-time insights into app speed, network performance, and stability. It is easy to integrate and widely used for mobile apps.
New Relic
New Relic offers advanced monitoring across applications and infrastructure. It is ideal for businesses that need deep analysis and scalability.
Datadog
Datadog combines performance tracking with cloud monitoring and security features. It is well-suited for modern applications.
AppDynamics
AppDynamics connects technical performance with business outcomes, helping you understand how performance impacts revenue.
Choosing the right tool depends on your needs, budget, and technical environment.
Real-World Example: Performance and Revenue
A leading travel app noticed that users were abandoning the booking process.
After analyzing performance data, they discovered that the payment page took too long to load.
By optimizing the page and reducing load time, they increased conversions significantly.
This example shows how performance analytics can directly impact revenue.
Strategies to Improve App Performance
Optimize Code Structure
Clean and efficient code reduces processing time. Removing unnecessary elements can improve speed instantly.
Use Caching Techniques
Caching allows frequently used data to load faster, improving response time and reducing server load.
Implement Content Delivery Networks
CDNs store content closer to users, reducing latency and improving load speed.
Monitor Performance Continuously
Real-time monitoring helps detect issues early and fix them before they affect users.
Test Across Devices and Networks
Different users have different devices and internet speeds. Testing ensures consistent performance for everyone.
App Performance and User Experience
User experience is directly linked to performance.
A fast app feels smooth and reliable. A slow app feels frustrating and broken.
Performance affects how users perceive your brand. It influences whether they stay, engage, or leave.
Improving performance is one of the simplest ways to enhance user satisfaction.
Impact on Marketing and Conversions
App performance plays a crucial role in marketing success.
For businesses running account-based marketing campaigns, every interaction matters. High-value users expect a seamless experience.
If your app is slow or unstable, even the best campaigns fail.
But when performance is optimized, users engage more, trust your brand, and convert faster.
Performance analytics also helps marketers understand user behavior and refine strategies.
Data-Driven Decision Making
App performance analytics allows you to make decisions based on real data.
Instead of guessing what users want, you can see actual behavior patterns.
You can identify which features work well and which ones need improvement.
This helps you prioritize updates and allocate resources effectively.
Common Challenges
Handling large volumes of data can be difficult without the right tools.
Identifying the root cause of performance issues is another challenge. Problems can come from code, servers, or networks.
Privacy concerns must also be addressed. User data should be collected and stored securely.
Despite these challenges, the benefits of performance analytics far outweigh the difficulties.
Future Trends in App Performance Analytics
The future of app performance analytics is driven by artificial intelligence and automation.
AI can detect patterns, predict issues, and even suggest solutions automatically.
Real-time analytics will become faster and more accurate, allowing businesses to respond instantly.
User experience will remain the main focus, with performance playing a central role.
Conclusion
App performance analytics is not just a technical necessity. It is a business strategy that drives growth, engagement, and revenue.
A fast and reliable app builds trust, improves user experience, and increases conversions.
If you want your app to succeed, you must invest in performance analytics.
Start today. Track the right metrics, use the right tools, and continuously improve your app.
The results will speak for themselves.
FAQs
What is app performance analytics used for
It is used to monitor and improve how an app performs in terms of speed, stability, and user experience.
Why is app performance important
Good performance improves user satisfaction, increases engagement, and boosts conversions.
Which tools are best for app performance analytics
Popular tools include Firebase, New Relic, Datadog, and AppDynamics.
How can I improve my app performance
You can improve performance by optimizing code, using caching, implementing CDNs, and monitoring real-time data.
What metrics should I track
Important metrics include load time, crash rate, latency, retention rate, and session duration.
